
In beta · USP · Cell culture
Expert Bioreactor Designer
Simulate a CHO cell culture from inoculation to harvest — the cells, the feeds, and the DO and pH control that hold them — solved together, every six minutes of culture time.
“How will pH control behave once the cells start making acid — and will my base addition keep up?”
What it's for
The point is what they do to each other
As the cells grow, they need more oxygen and make more acid. The controllers answer with agitation, gas and base until one of them runs out of room. The app shows when and why that happens, and how much headroom the vessel has left.
It is a design and teaching tool for the control of DO and pH: what a culture asks of its vessel, which limit binds first, and what each lever costs.
Four things, solved together
- The cells
- How fast they grow, what they consume, and what they make — lactate, ammonia and CO₂.
- The feeds
- What goes into the vessel and when, and what perfusion takes out.
- DO control
- Agitation, gas flow and oxygen enrichment, raised and lowered to hold dissolved oxygen at its setpoint.
- pH control
- CO₂ added to or stripped from the gas, and base pumped in, to hold the pH at its setpoint.
In the app
Designed to show one thing at a time
A dozen designs, one effect each
Ready-made batch, fed-batch and perfusion designs, each built to show one thing. Pairs differ in one setting only: a pilot-scale batch where limits that look generous at the bench start to bind, and the same batch dosed with sodium hydroxide, carbonate or bicarbonate.
Culture profiles
Ten versions of the featured fed-batch with the cells reshaped — denser, slower, a lactate curve that crashes or rises late — including two published cultures (Toussaint et al., 2016) reproduced by turning nine knobs.
Eight parts to every design
Reactor, initial state, DO control, biology, basal medium, feed strategy, pH control and solver. Each opens at three depths: the few settings most runs need, the equipment limits, or everything.
Checked before it runs
A badge checks the design against its vessel and blocks a run the vessel can't hold. Assess runs the design with everything the vessel has, and says whether the vessel itself is the limit.
Cause and effect
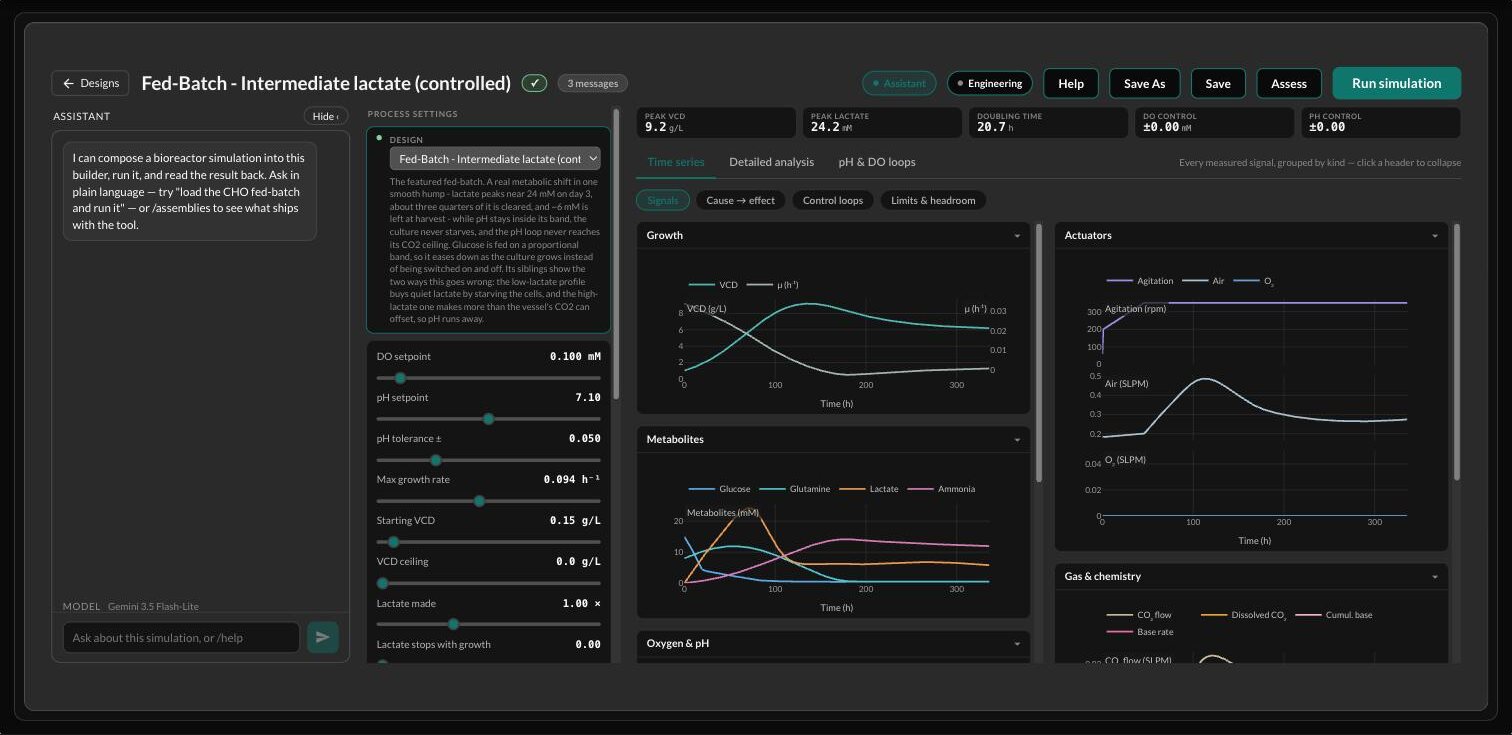
Read a run as a chain: what the cells demanded, what the vessel could deliver, what the controllers moved, and what happened. The loops board splits DO and pH into what pushed each one and how it was held.
Two weeks in seconds
A 10- to 14-day run takes a few seconds, so you can change one thing and see what it does. The assistant can build and run a design from a plain-language request.
How far to trust the numbers
Consistent and repeatable — not a prediction for your cell line
We would rather you knew this before you ran anything.
- The cells are plausible, not validated.
- The shipped cell lines were tuned to land in agreed ranges for a CHO culture — a fed-batch peak of 15 to 30 million cells per mL, for example — not fitted to measured data. The profile knobs can reshape the curves to look like your culture, but a matched curve is not a validated model.
- Lactate per glucose is low.
- Most shipped lines make 0.4 to 0.9 mol of lactate per mol of glucose while they grow. Real CHO cultures typically make 1.0 to 1.8.
- Oxygen demand may be low.
- Counted per cell, the model's oxygen uptake sits below the values usually published for CHO. Compare it with your own data, and adjust it if you need to.
- kLa comes from a typical correlation, not your vessel.
- No vessel's kLa has been compared with a measured one, and published coefficients vary several-fold.
- CO₂ stripping is optimistic at large scale.
- Treat pCO₂ at production scale as a lower bound.
- Control is ideal.
- The controllers know the culture exactly, act every six minutes, and see no probe lag or noise. The DO and pH tracking are a best case.
Use it to compare designs with each other, to find out which limit binds first and when, and to learn how the loops interact. Don't use it to predict an absolute titer, peak density or production-scale pCO₂.
What the model leaves out
Product titer and quality; viability (it tracks viable cells only); the cells' responses to pH, temperature, pCO₂ and osmolality; nutrients other than glucose and glutamine; mixing gradients; probe lag and noise; evaporation and sampling.