

In beta · PD · MSAT
Expert Solution Operations Designer
Plan what happens in a vessel, step by step: make the solutions you need, add them, titrate, dilute — and see the pH and the composition at every point.
“After I titrate, dilute and condition a pool — what is actually in the tank now?”
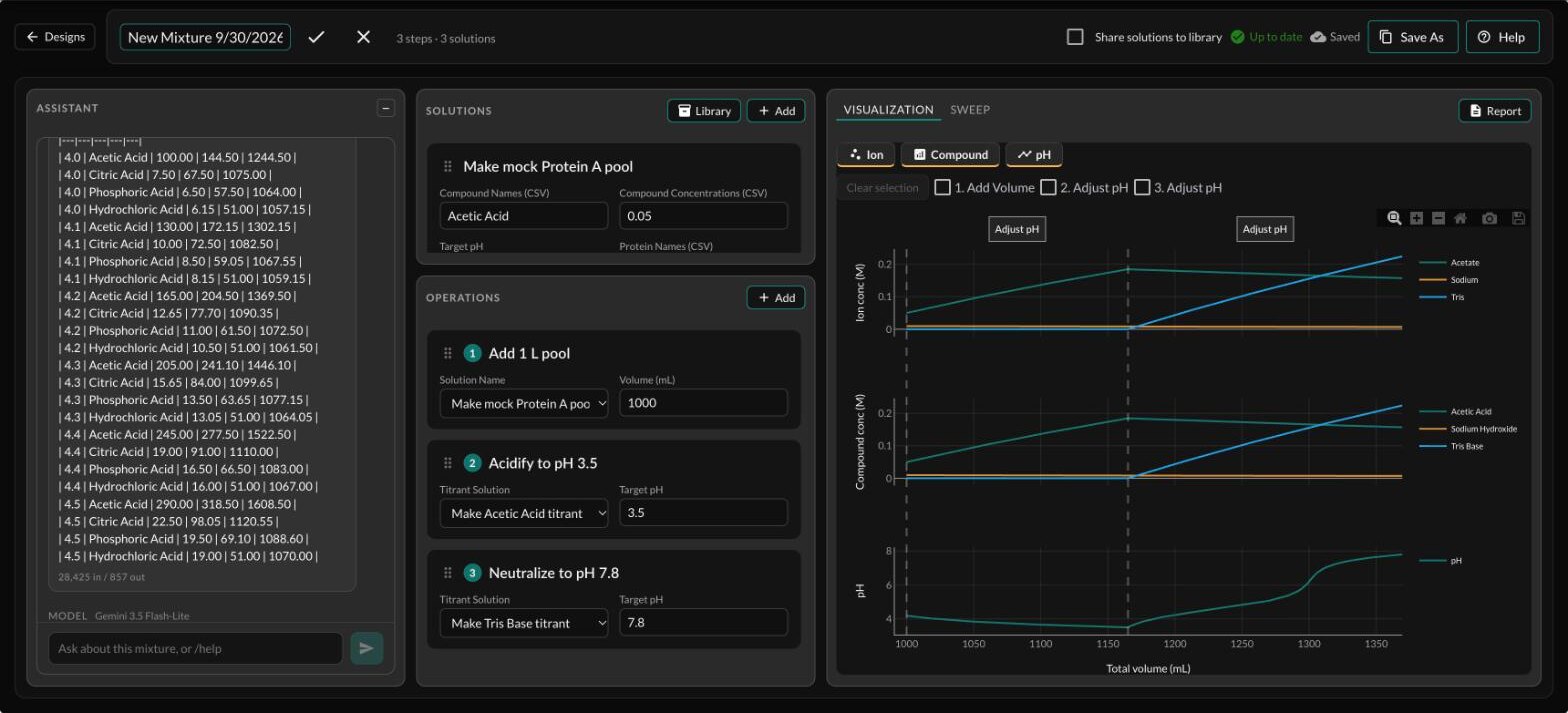
One Protein A pool, three ways to neutralize it.
Simulated in this app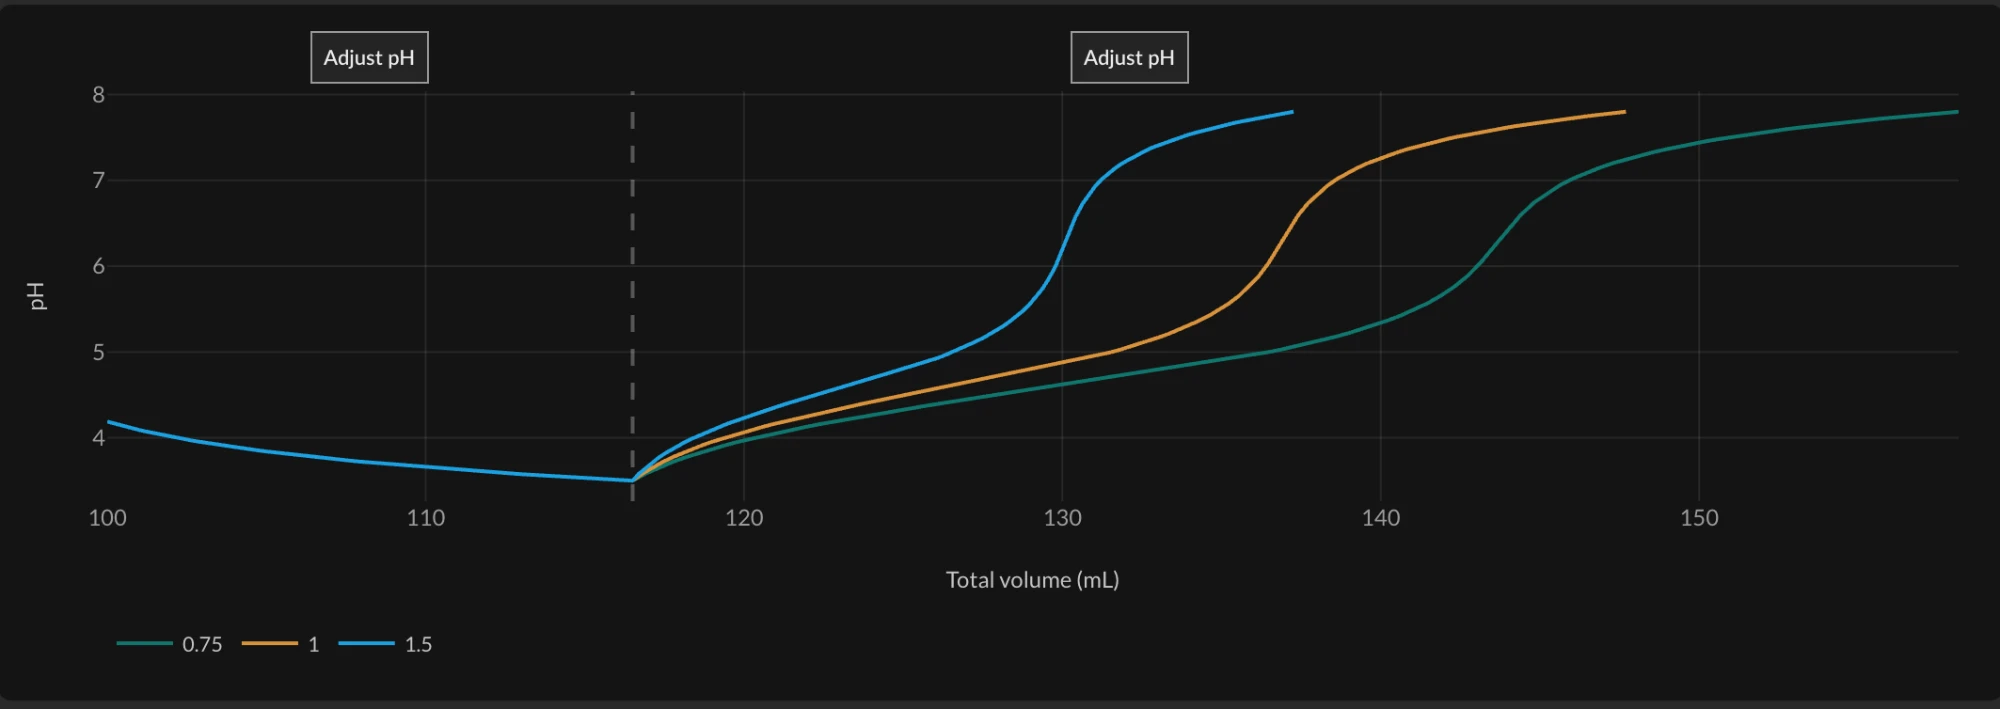
What it's for
Everything that happens to a pool between the columns
Pool conditioning between chromatography steps, viral-inactivation holds, titration planning, and checking what a dilution or a salt addition does to the pH. After every step the app works out the vessel's volume, its composition and its pH, draws the whole trajectory, runs what-if sweeps, and writes a report you can prepare from.
A design has two lists. Solutions are what you prepare — a buffer, your own list of compounds, a stock, or a solution saved anywhere in the suite. Defining one puts nothing in the vessel. Operations are what happens to the vessel, in order, and each one runs as soon as it's filled in.
The operations
- Add volume
- Pour in a volume of one of your solutions.
- Adjust pH
- Titrate to a target pH; the app finds the titrant volume and draws the real titration curve.
- Dilute
- Add water by a factor, and see the pH move even though no acid or base went in.
- Dilute to ion conc
- Add water until an ion falls to its target.
- Target compound
- Bring a compound to a target concentration, by mass balance.
- Target ion
- Bring an ion's total to a target, up or down.
Ready-made
Eighteen designs to start from
Grouped as Buffers, Bioprocess and Learn. The Bioprocess designs include three complete antibody process trains and four 10× buffer concentrates; the Learn designs show textbook effects, such as why dilution moves the pH and why salt does. Four of them are mini-apps: a ready-made tool with a few inputs, for one question.
Titration curve: weak acid → base
The shape of a titration curve through the buffering region.
Viral inactivation: acidify → hold → neutralize
How much acid takes a pool to the hold pH, and how much base brings it back.
Condition a buffer to a target conductivity (salt)
Drive a buffer to a chloride level for loading or elution, and see the pH drift that comes with it.
What to add: hit a target buffer concentration AND pH
What to add to an existing buffer to reach a new buffer concentration and pH.
A common bench error, shown
Don't titrate the concentrate
A 10× concentrate is the 1× buffer with every compound multiplied by ten. Its own pH differs from the 1× pH, because the ionic strength changes with concentration — and diluting it tenfold gives exactly the 1× buffer. Titrating the concentrate to the 1× pH is a common bench error, and it is what ruins the diluted buffer. The app shows both numbers, so the mistake is hard to make.
Works with the Buffer Designer
One buffer, one answer
For the same buffer at 25 °C, this app and the Expert Buffer Designer compute the same composition, and the pH in the vessel agrees with the bottle's pH to within a few hundredths. Share a buffer to the library in one app and use it in the other.
How far to trust it
Checked where we can, and honest where we can't yet
The salt corrections are checked against published measurements of how pKa values shift in salt solutions. Across phosphate, acetate and borate, the typical (root-mean-square) pH error is 0.02 up to 0.25 M ionic strength, 0.07 between 0.25 and 1 M, and about 0.3 above 1 M.
The operations themselves are checked for consistency: a buffer poured into an empty vessel reads within a few hundredths of the bottle's pH, titrations land on their target, and concentrates dilute back to their 1× pH. Whole workflows, such as how much base a pool takes, have not yet been compared with bench titrations. Treat titrant volumes as a starting point, and confirm them in the lab.
What the model leaves out
Temperature (everything is calculated at 25 °C); heat of mixing; volume change on mixing; solubility and precipitation; carbon dioxide from the air; time (every step is instant equilibrium); the columns themselves; and real proteins. Treat pH values above about 1 M ionic strength, including 10× concentrates, as indicative.